
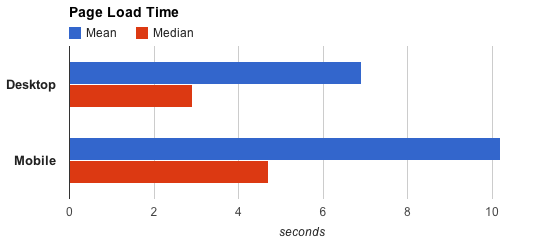
Mobile internet is growing at an incredible rate and as we can see from the data above, mobile experience is about 1.5x slower than desktop experience. That’s a very big difference, and that is even taking into account that many popular sites are already optimizing for the mobile visitor: fewer resources, smaller resources, and smarter caching strategies.
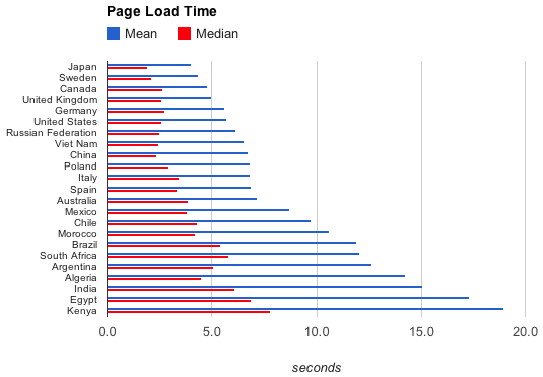
The following interactive world map presents the page load times for desktop in seconds for the complete list of countries with enough samples for accurate measurement:
The following map presents the corresponding data for mobile.
Note that there are many factors that play a role in overall speed of web pages as experienced by users. The browser, the network connection, the client hardware (processing power), the content of the web page, and the hosting location of the web site relative to the user all impact the speed of an individual page load. As a result, the country aggregates listed above depend on all those factors as well.
Finally, let’s take a look at relative page speeds across some of the popular verticals:
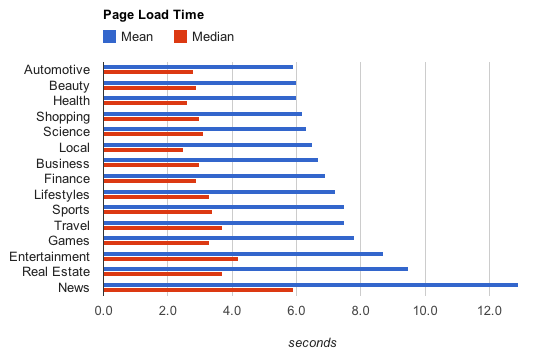
How does your site stack up?

