
This is the first in a series of posts highlighting the new Google Analytics. The new version of Google Analytics is currently available in beta to a small number of Analytics users. We’ll be giving access to more users soon. Sign up for early access.
Today, we would like to introduce you to the new dashboards that is available in the new version of Google Analytics announced last week.
Custom Dashboards
For most Google Analytics users, the dashboard is the first thing you see when viewing your reports. Dashboards in the new version of Google Analytics have been redesigned to be completely widget-based and highly customisable. There are four types of widgets: Metric, Pie Chart, Timeline, and Table. This gives you the ability to choose the visualisation that best suits the data you want in your dashboard. The Dashboard uses a three-column layout, and you can customise the layout by dragging and dropping the widgets as you’d like.
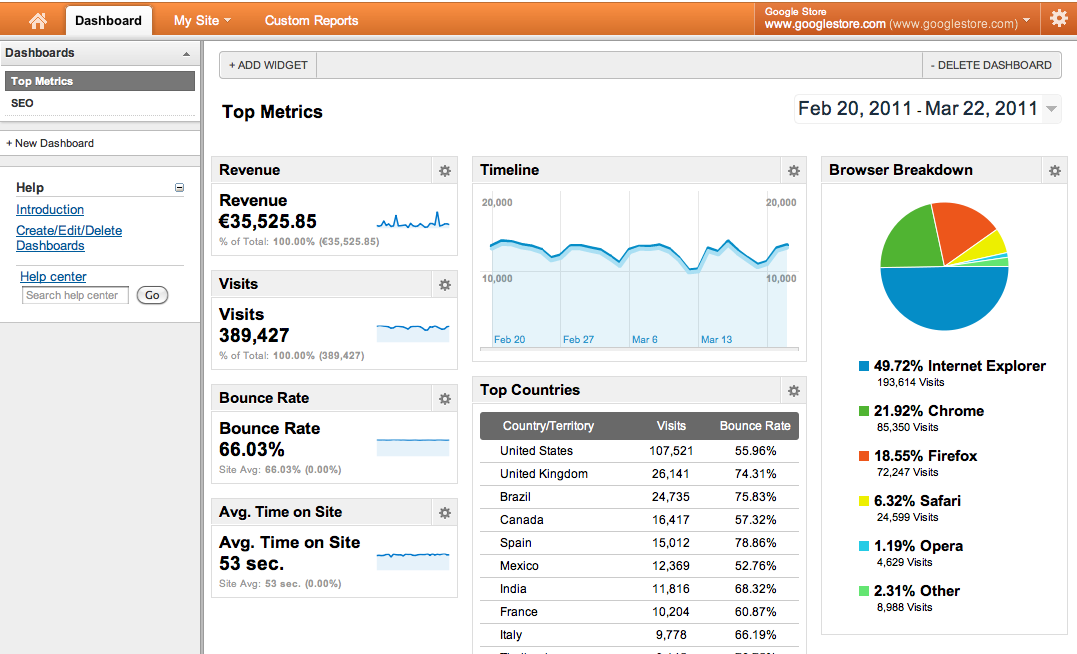
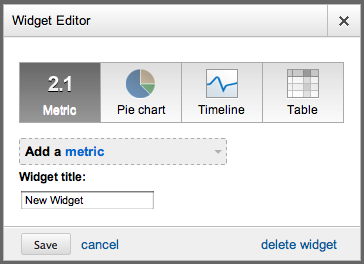
- Metric: Shows the value of a metric and a sparkline of that metric over the selected time period
- Pie Chart: Best suited for displaying breakdowns of a metric by a certain dimension. E.g., Visits by Browser Type.
- Timeline: A graph of any metric over time. You can also compare two metrics in the same graph.
- Table: Think of this as a mini-custom report. You can show one dimension with two metrics and up to 10 rows of data in a table.
Multiple Dashboards
A common request we heard from you all is that one dashboard isn’t enough. You told us that wanted the ability to customise multiple dashboards for different analyses. Thanks to the new Google Analytics platform, we’re happy to give you the power to create multiple custom dashboards, up to 20 per profile. You might start with an overall “Company KPIs” Dashboard that includes the most important performance indicators for your company, then create an “SEO” Dashboard for your search engine optimisation efforts, and a “Content” Dashboard that centers around the content of your website. We’d love to hear what you do with the other 17 slots.
Going Forward
The core functionality for the new dashboards is ready for you to use, but this isn’t everything we’ve planned for dashboards in the new version. Because we are so excited about the new Dashboard, we decided to make its core features available to you first. For starters, we still need to bring some of the features from the current dashboard over, such as the ability to share, email, and export a Dashboard. We are actively working on them (along with many other improvements), so please stay tuned.
We hope you will find the Dashboards in the new Analytics easy and fun to use. Happy Dashboarding!
Posted by Yi Wang, Product Manager, Google Analytics team